RBF
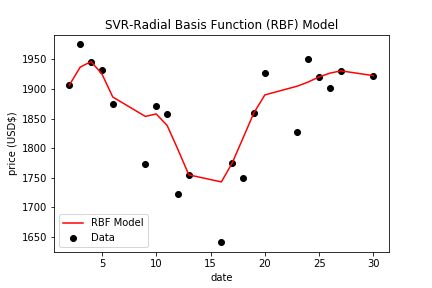
See dates on the x-axis of this graph, 27th of March which is the last Friday before Monday the 30th of March, data point can be seen lies on the Radial Basis Function (RBF) curve, and the data point is the predicted stock opening price for that day by this RBF model. This price matches with about $1,930 on the y_axis. See Amazon data table on top right corner where it can be cofirmed with the actual opening price on that day was same as the predicted price by this RBF model. Also, see 30th of March where the data point (which is the predicted opening price of $ 1,922) for that day matches with the one on Amazon Table.
The above Radial Basis Function (RBF) regression model shows that more data points lie and cluster near the non-linear RBF line than the dispersed (scattered) data points from the line or curve. Therefore, it's fair to say that this model has a high positive non-linear relationship with the data points, and our prediction accuracy will be higher, too. In the page where we have all three models in one graph we will provided our accuracy test (R-square) value on each of the model, and also the predicted opening price of stock for March 31st, 2020.Visualizations


