Linear Regression Model

It can be seen that there are only two data points that lie on this linear line while the data points on the scatter diagram are curvature or parabole, hence, the data points requires a non-linear function for a better fit. The model shows a week positive nonlinear correlation with the data points since more data are further away from the line. Since this model is a linear function, margin of tolerance or predictive power (R-square) will be negative and prediction with this model will not be relevant.
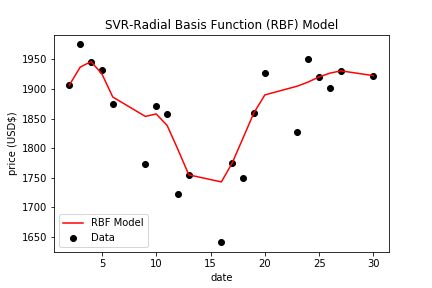
Visualizations