All Three Models in One Graph

The predicted prices for March from 2nd through 30th, can be seen in the graph which is a total of 21 data points corresponding to the total number of trading days. All the predicted prices may not be exactly the same with the actual opening prices on the Amazon data table due to forces of demand and supply. However, among the three functions in the above graph, rbf has a stronger positive non-linear correlation with the data points.
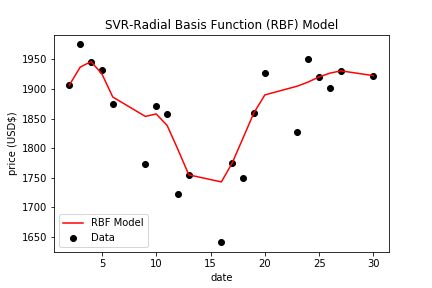
See our python pandas/matpotlib, the machine was not trained on the 31st of March data, but we were able to predict opening price using each of the three models. Predicted prices include:Linear model=$1,908.6500000000322, RBF= $1,910.508164163097, and Polynomial=$2,096.386910981095. Also in our python matplotlib are goodness of fit values which include: Linear regression R-square = -0.12102918330413459, RBF regression R-square = 0.759871821406584, and Polynomial regression R-square = 0.41375895743467533 The foregoing shows RBF predicted higher stock opening price for the 31st of March 2020, and its R-square value is approximately 76% accuracy or predictive power. Note: the linear function has a negative R-square and this appears due to the linear fuction being used when the data set requires a non-linear function, hence, this linear model cannot be relied in this case.Visualizations