Polynomial Regression Model

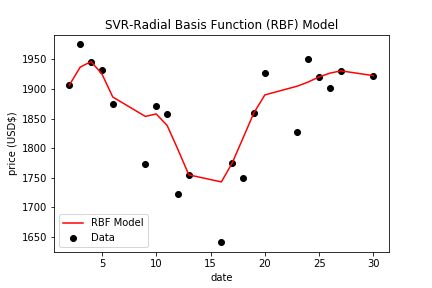
Stock markets are known to trade from Monday to Friday which is five days a week, hence, there are 21 data points (which represents predicted prices) in the graph which correspond with stock trading days from March 2nd through 30th. Dates are on the X_axis and 27th of March is the last Friday before Monday the 30th of March, data point can be seen lies on the polynomial curve, and the data point is the predicted stock opening price for that day by this polynomial model. This price matches with about $1,930 on the y_axis. See Amazon data table on top right corner where it can be cofirmed with the actual opening price on that day was same as the predicted price by this polynomial model.
It may be fair to say that the exact price match was achieved because of the supervised learning process whereby the machine was trained on the entire dataset. Whilst it can be said that this model has a fair positive non-linear correlation with the data points, the model shows more data points (opening prices) are dispersed or scattered from the non-linear polynomial line than the points that lie or cluster near the line. It could not even match the data point for 30th of March. Therefore, a better positive non-linear correlation with the data points will have more predictive power especially in the case of unsupervised learning as can be seen in our jupyter notebook.

