Amazon Stock prices for March in 2020
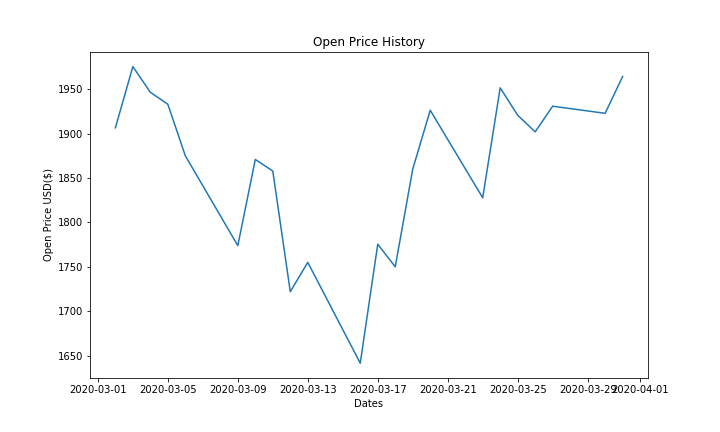
We used yahoo finance which is a python library to collect Amazon stock data from Nasdaq global electronic marketplace, and we created some python scripts to visualize the stock prices for the month of March, 2020. We only collected the month of March data as a sample from the stock data population.
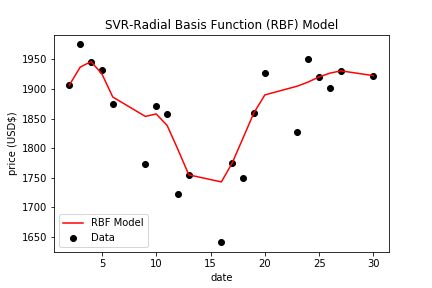
We built a series of scatter plots using Matplotlib to compare three Support Vector's Regression models that best fits the sampled data.
Our intent is to use the best fit model to make predictions of opening prices from 2nd of March through 30th of March, supervised learning. And also predicts 31st of March in our python pandas/matplotlib as unsupervised learning. Supervised learning in the sense, we fit the models to the data from 2nd of March through 30th of March (train the machine with the data) to make best prediction. While we also predict the 31st of March in our python pandas/matplotlib without necessarily fitting the models to it, hence, we call this unsupervised or semi-unsupervised learning. Select any model from the dropdown at top right corner to view the analysis of each model.Visualizations